Example Investment Results
This section displays graphs and charts that represent
a few of those created for Asset Allocation Audit reports. The fictitious
XYZ Corporation is the retirement fund sponsor. ABC Advisors is
a fictitious portfolio manager.
Total Fund | Portfolios
Total Fund
The first two charts in this section provide the context in which
this analysis can best be interpreted. The Investment Environment
chart presents wealth indices for each asset class included in the
XYZ Retirement Fund's policy allocation.
The similar Fund Policy and Performance chart plots two related
indices. The hybrid Policy Index represents the performance of the
Fund's policy mix of asset classes. The Performance Index presents
the Fund's actual performance, treating it as one aggregate portfolio.
Its persistent shortfall from the policy index reflects negative
influences from policy implementation and portfolio management.
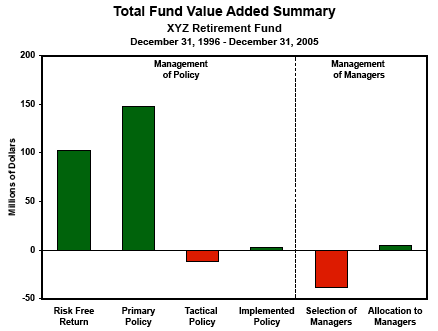
Total Fund Value Added Summary
This chart summarizes the value added or diminished by each of
the primary groups of investment decisions described in the report.
It illustrates the relative significance of these influences over
the nine years included in this analysis and provides a visual
measure of the effectiveness of the investment management process.
Levels 3-6, combined, account for the gap between policy and
performance in the graph above. Although the rate of return shortfall
averaged less than 1% per year, the value impact was $42 million.

Level 1 - Risk Free Return
The entire XYZ Retirement Fund theoretically could have been invested
only in U.S. Treasury bills for the entire period. Assets would
have increased by $102 million, risk free, if such a policy had
been applied.
Level 2 - Primary Policy
If these same available assets had been invested in the primary
policy mix of benchmark funds for the entire nine years, this basic
policy would have returned $148 million in addition to its risk
free component.
Level 3 - Tactical Policy
XYZ's directors authorized management and staff to temporarily
weight the policy mix differently to address changing market conditions.
They also allowed staff to divide the primary policy into sub-classes
and emphasize certain investment management styles to take advantage
of particular securities markets segments. These choices reduced
the fund's potential value by $12 million during this nine-year
period.
Level 4 - Implemented Policy
This level of the Audit examines departures of the actual mix of
asset sub-classes from the tactical policy mix evaluated previously.
Asset values from the previous level serve as the basis for measuring
the effect of these departures. In this example, the effect was
positive by $3 million.
Level 5 - Selection of Managers
For this time period, the team of managers selected to add value
to the XYZ Retirement Fund was not able to do so. The shortfall
resulting from their involvement was $38 million.
Level 6 - Allocation among Managers
Potential value is lost when under-weighted managers produce above-average
returns and when over-weighted managers fall short. The allocation
among the XYZ Retirement Fund portfolios was beneficial during this
period. The affect was a net value gain of over $5 million.
To Top
Portfolios
The values presented at Levels 5 and 6 in the Total Fund Value
Added Summary account for the aggregate results from all portfolio
managers' efforts to exceed their respective benchmark returns.
Each manager's portion of the total impact is presented in a similar
summary. An example, ABC Advisors, follows.
Portfolio Value Added Summary
This Value Added Summary chart separates the values added or diminished
by the four major determinants of the ABC portfolio return. It first
isolates the value attributable to the sponsor's policy, then presents
the incremental values added or lost by the manager in its effort
to outperform the policy benchmark.
Sponsor's Benchmark
The benchmark against which this example ABC portfolio is measured
is the S&P 500 Index. It's impact is separated because it
represents the value a benchmark portfolio would have added without
the manager's involvement. During this nine-year period, the benchmark
contributed $36 million of XYZ's policy return.
Manager's Market Timing
ABC's timely changes in cash reserves added $3 million to the portfolio's
value over the 9-year period.
Manager's Security Selection
The selection and weighting of a narrower group of securities than
are included in the benchmark index caused the portfolio to loose
$7 million of potential value.
Management Fees
Fees paid to ABC Advisors further reduced the portfolio's value
by
$2 million.
To Top
|